
Introduction (Best Indicators for Intraday Trading)
Intraday trading, the art of buying and selling financial instruments within the same trading day, demands quick decision-making and a keen understanding of market dynamics. To navigate the fast-paced world of intraday trading successfully, traders often turn to technical indicators. These tools help analyze price movements, identify trends, and generate signals that guide trading decisions. In this blog, we will explore some of the best indicators for intraday trading to enhance your chances of success in this dynamic market.
The best Indicators for Intraday Trading are below:
Table of Contents
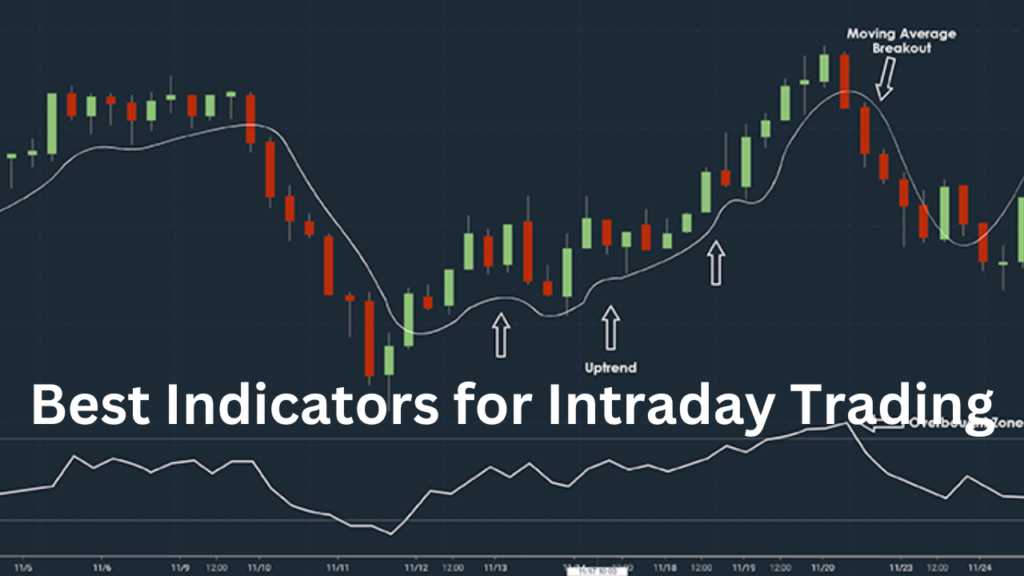
Moving Averages
This is one of the best indicators for the intraday trading. Moving averages are fundamental indicators that help smooth out price data to identify trends more effectively. The two main types, simple moving averages (SMA) and exponential moving averages (EMA) are commonly used in intraday trading. Short-term moving averages, such as the 9-period or 20-period EMA, are particularly useful for capturing short-term price trends.
Relative Strength Index (RSI)
One of the best indicators for Intraday trading is RSI. The RSI is a momentum oscillator that measures the speed and change of price movements. It ranges from 0 to 100 and is typically used to identify overbought or oversold conditions in a market. Intraday traders often use the RSI to spot potential reversal points, helping them enter or exit trades at optimal times.
The RSI is calculated using the following formula:
RSI=100− 100/1+RS
Where RSI (Relative Strength Index) is the average of ‘x’ days’ up closes divided by the average of ‘x’ days’ down closes.
The RSI ranges from 0 to 100, with readings above 70 typically indicating overbought conditions, suggesting a potential reversal or correction. Conversely, readings below 30 suggest oversold conditions, hinting at a potential upward price reversal.
Bollinger Bands
Bollinger Bands consist of a middle band being an N-period simple moving average and upper and lower bands that are standard deviations away from the middle band. These bands help identify volatility and potential trend reversal points. Intraday traders can use Bollinger Bands to spot periods of low volatility (potential breakout opportunities) and overbought/oversold conditions.
Stochastic Oscillator
The Stochastic Oscillator is another momentum indicator that compares the closing price of a security to its price range over a certain period. It helps identify potential trend reversals by indicating overbought or oversold conditions. Intraday traders often use the Stochastic Oscillator in conjunction with other indicators to confirm signals.
MACD (Moving Average Convergence Divergence)
MACD is a trend-following momentum indicator that shows the relationship between two moving averages of a security’s price. Traders look for crossovers and divergences in the MACD line and signal line to identify potential entry or exit points. The histogram component of MACD illustrates the difference between the two lines.
Fibonacci Retracement
While not a traditional indicator, Fibonacci retracement levels are widely used by intraday traders to identify potential support and resistance levels. These levels are derived from the Fibonacci sequence and can help traders anticipate price retracements and extensions. The Fibonacci sequence is a series of numbers where each number is the sum of the two preceding ones: 0, 1, 1, 2, 3, 5, 8, 13, 21, and so on. The sequence has remarkable mathematical properties and is found in various natural phenomena.
Conclusion
Successful intraday trading requires a combination of technical analysis skills, market knowledge, and a strategic approach. The indicators mentioned above are powerful tools that, when used judiciously, can enhance your decision-making process and increase the probability of profitable trades. However, it’s important to note that no indicator guarantees success and a comprehensive understanding of market conditions is essential for effective intraday trading. As always, practice, discipline, and continuous learning are key components of a successful intraday trading strategy.
2 thoughts on “Unveiling the Best Indicators for Intraday Trading Success”